
WorksheetPremium
What Will Change at Ravine Lookout?
Use park reports and a graph to compare quick and slow Earth changes, then make predictions supported by evidence.
Grade 2ScienceInteractive · Printable
Aligned to2-ESS1-1
Or unlock every Premium worksheet with Premium
What’s included
- Single worksheet
- Auto-graded online
- 1 NGSS standard
- Printable answer key
- 13 questions
- Classroom-ready
Details
- Format
- Interactive · Printable
- Grade
- Grade 2
- Subject
- Science
- Question types
- Fill in the blank, Multiple choice, Circle the answer, Sorting, Short answer
About this worksheet
What students practice
- Students use time clues to compare Earth events that happen quickly and very slowly.
- Students use records of Earth changes to make and explain predictions.
How to use
Read the park reports together and review the graph labels. Have students use time clues to support their answers and predictions.
Curriculum
NGSS standard covered
Use information to show that some Earth events happen quickly and others happen very slowly.
Preview
OwlSheets.com
What Will Change at Ravine Lookout?
Use time clues to predict changes in a city park.
Study the Park Records
Read the reports and graph. Use their time clues to answer the questions.
Reports from Ravine Lookout
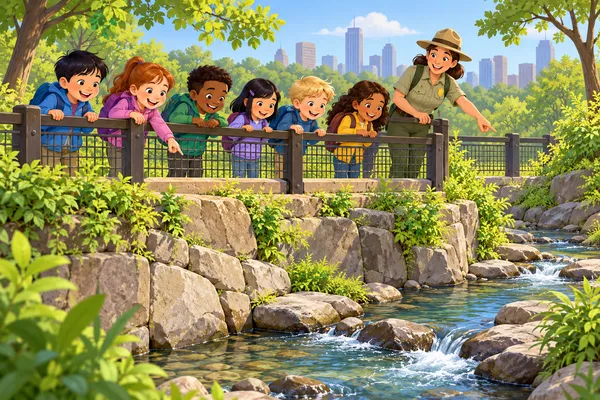
Ravine Lookout is a fenced viewing area in a city park. From behind the fence, visitors can see a creek, soil slopes, and rock walls. These made-up ranger records describe changes there. Visitors stay away from the steep slopes.
Rockfall report: A loose rock broke away from a wall. It fell and landed on the ground within 5 seconds.
Soil channel report: During a heavy rainstorm, flowing water cut a new channel in loose soil. The channel formed in 2 hours.
Creek groove report: Rangers measured the same groove in the rocky creek bed over many years. The graph shows how much deeper the groove became after their first measurement. Water kept flowing over the rock during those years.
Rock marker report: An old rock marker stood beside the lookout. After 100 years of wind and rain, it was 1 centimeter thinner. Rangers compared careful measurements from the beginning and end of that time.
- A. Changes in rock take longer than changes in soil.
- B. Changes to land can take very different amounts of time.
- C. The creek groove changed faster than the soil channel formed.
- D. The rock marker changed faster than the loose rock fell.
The preview shows the first questions. Unlock the worksheet to see all of it.
Related worksheets
 Worksheet
Grade 2
Two Coasts, Two Clocks
Earth & Space Science · 2-ESS1-1
Premium15 questions
 Worksheet
Grade 2
Rain on the Kitchen Patio
Earth & Space Science · 2-ESS1-1
Premium15 questions
 Worksheet
Grade 2
The School Kitchen Earth-Change Chain
Earth & Space Science · 2-ESS1-1
Premium15 questions
 Worksheet
Grade 2
How Long at Icefield Trail?
Earth & Space Science · 2-ESS1-1
Premium14 questions
 Worksheet
Grade 2
Time Detectives at Lava Flat Camp
Earth & Space Science · 2-ESS1-1
Premium14 questions
 Worksheet
Grade 2
Build a Time-Smart Bat Cave Display
Earth & Space Science · 2-ESS1-1
Premium13 questions